













































































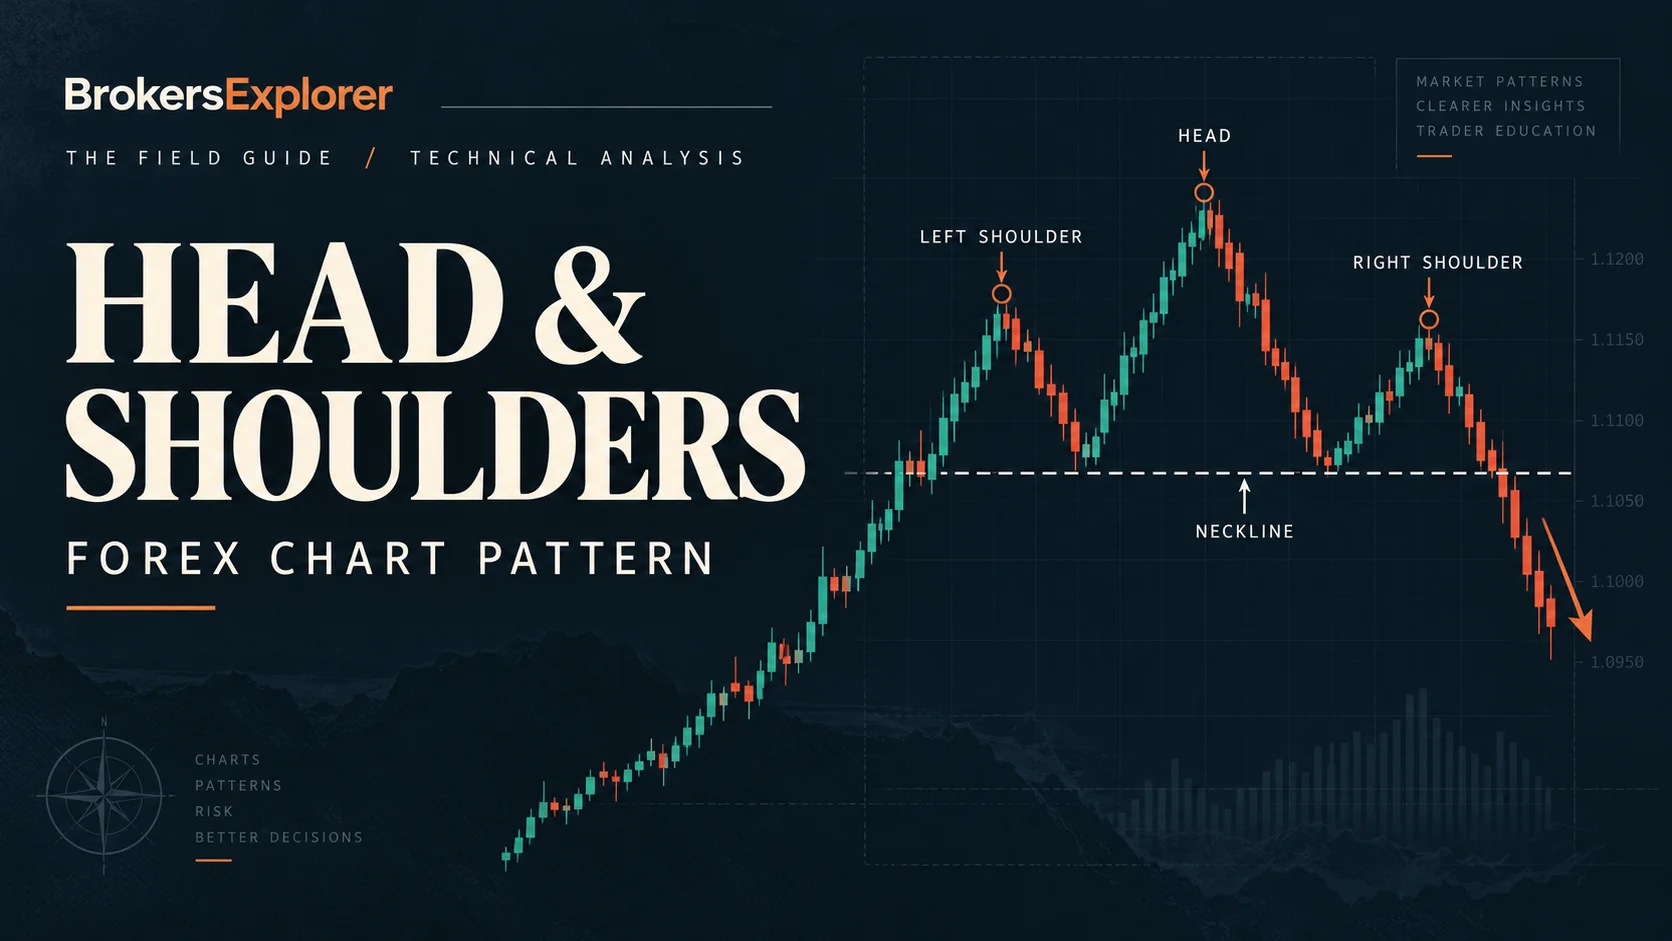
A head-and-shoulders pattern can suggest that a forex trend is running out of momentum. The regular version points to a possible bearish reversal; the inverse version points to a possible bullish reversal. The distinction that matters is not whether the chart resembles three peaks or troughs, but whether price subsequently breaks the neckline. This guide explains the structures, trade planning and limits of the signal.
What is a head-and-shoulders pattern in forex?
A head-and-shoulders formation develops through several swings in a currency pair's price. Traders use it to look for a possible change in the prevailing trend rather than a single-candle signal. It is a chart-reading framework, not a forecast that can be confirmed merely by drawing three turning points. StockCharts' pattern reference describes the regular formation as a potential reversal after an uptrend.
| Feature | Regular pattern | Inverse pattern |
|---|---|---|
| Typical prior trend | Uptrend | Downtrend |
| Shape | Three peaks, middle highest | Three troughs, middle deepest |
| Neckline | Connects two reaction lows | Connects two reaction highs |
| Confirmation direction | Close below neckline | Close above neckline |
| Potential implication | Bearish reversal | Bullish reversal |
Regular head and shoulders: bearish pattern
After an advance, price reaches a left-shoulder peak and pulls back. It then rises to a higher high—the head—before declining again. A third rally forms a right-shoulder peak below the head. This lower final peak can indicate that buyers have not sustained the prior upward pace, but the shape alone does not establish a sell signal.
Inverse head and shoulders: bullish pattern
The upside-down version follows a decline: a left-shoulder trough is followed by a deeper low at the head, then a right-shoulder low that stays above the head. The intervening bounces supply the reference highs for the neckline. It is often described as a head-and-shoulders bottom or reverse head-and-shoulders pattern; these names refer to the same configuration. See StockCharts' inverse-pattern description.
Drawing the neckline and confirming the pattern
On the regular pattern, connect the two pullback lows between the peaks. For the inverse, connect the two rebound highs between the troughs. The neckline can be horizontal, rising or falling; on a sloping line, use its value at the breakout candle rather than treating the first neckline point as a permanent horizontal price.
A practical confirmation rule is to wait for a completed candle to close below the regular neckline or close above the inverse neckline. A temporary intrabar crossing can reverse before the candle finishes. TradingView's inverse-pattern documentation similarly distinguishes an emerging formation from one confirmed by a close above the neckline. Neither close guarantees continuation.
How to trade a confirmed breakout
- Set the chart context. Select a currency pair and a consistent chart timeframe, then identify the preceding trend rather than starting from three isolated turning points.
- Mark the formation. Label the left shoulder, head and right shoulder; draw the neckline through the appropriate two reaction points.
- Apply the planned confirmation rule. Record the breakout candle and do not change the rule halfway through the setup to justify an early trade.
- Plan the order. After confirmation, determine whether the setup calls for a short (regular) or a long (inverse) entry, and use the prices at which that position could actually be executed.
- Define risk before placing the order. Specify the stop, measured objective and a position size that fits the cash amount at risk.
- Record a cancellation condition. If price invalidates the setup before entry, leave the order unfilled or cancel it according to the chosen rules.
Breakout entry versus neckline retest
A breakout entry acts soon after the confirming close and may capture a move that never returns to the neckline. Its disadvantage is that an extended breakout candle may leave an unattractive distance to the stop. A retest entry instead waits for price to revisit the broken line, sometimes offering a more favorable entry; the trade-off is that the retest may never happen or may break back through the line.
For a regular pattern, a former neckline support level may become resistance on the retest; for an inverse, former resistance may become support. Those are possible behaviors, not guaranteed price reactions.
Stop-loss placement, price targets and position sizing
A common structural stop for a short trade sits above the right-shoulder high; for an inverse long trade, it sits below the right-shoulder low. The planned stop should reflect the chart's structure and leave a defensible margin for ordinary price variation. A tighter stop produces smaller calculated risk but does not necessarily make the pattern less likely to stop out.
The conventional measured-move target uses the vertical distance from the head to the neckline at the head's time. For a flat neckline, subtract that distance from the regular pattern's neckline to project a bearish objective; add it to the inverse neckline for a bullish objective. If the neckline slopes, keep the head measurement vertical and apply the distance at the breakout-time neckline. The projection is a reference level, not a probability or a guaranteed destination.
Calculate stop distance from the planned entry, not from the neckline, and express it in pips before sizing the trade. For EUR/USD, where USD is the quote currency, a 10,000-EUR position changes by approximately $1 per standard 0.0001 pip; pairs with other quote currencies or accounts denominated outside USD require conversion. The prospective reward-to-risk ratio is the distance to the target divided by the distance to the stop, before costs.
Worked EUR/USD example
Assume a hypothetical regular head-and-shoulders pattern with a flat neckline at 1.1020. These are deliberately constructed levels, not a record of a real EUR/USD session.
| Element | Illustrative EUR/USD level or value |
|---|---|
| Left shoulder / head / right shoulder | 1.1080 / 1.1150 / 1.1090 |
| Neckline | 1.1020 |
| Entry after qualifying break | Short at 1.1015 |
| Stop-loss | 1.1100 (above right shoulder) |
| Head-to-neckline height | 130 pips |
| Measured target | 1.0890 |
| Entry-to-stop risk | 85 pips |
| Entry-to-target reward | 125 pips |
| Gross reward-to-risk | 125 ÷ 85 = 1.47:1 |
The target comes from 1.1020 − (1.1150 − 1.1020) = 1.0890. The short entry is five pips below the neckline, so the possible gain to that target is 125—not 130—pips. At a hypothetical 10,000-EUR position size, the planned gross loss at the stop is $85 and gross gain at the target is $125, before charges and execution differences.
With a hypothetical $100 cash risk budget, the same 85-pip stop would permit at most about 11,764 EUR of exposure under these simplified assumptions; the lot increment offered by the broker would determine the usable smaller size. A 10,000-EUR example position would remain within that pre-cost risk budget.
Failed and incomplete head-and-shoulders patterns
A setup that never meets the predefined breakout rule is an unconfirmed formation, not a losing trade. Recording it as a failed breakout would distort any later assessment of the strategy.
After a bearish breakdown, a close back above the neckline warns that selling pressure may not be sustaining the move; an advance through the right shoulder more clearly undermines the proposed bearish structure. Reverse these conditions for the inverse pattern: a fall below the neckline is a warning, while a move below the right shoulder is a stronger invalidation. TradingView's automated inverse-pattern tool, for example, calls a formed pattern failed when the target is not reached before price trades below the right shoulder.
A quick return across the neckline does not have one universally accepted failure definition. Traders using a strict neckline-recross rule can treat that crossing as an exit trigger; others may specify the shoulder extreme instead. The distinction should be written into the plan before the order is opened rather than decided after a loss begins.
Forex-specific considerations
Most spot foreign exchange activity takes place over the counter across dealers and venues rather than through a single centralized exchange. As the Bank for International Settlements' FX execution analysis explains, the market is fragmented and substantial trading is internalized. Two retail platforms can therefore display slightly different quotes and chart shapes for the same pair, particularly around a narrowly defined neckline.
Tick volume versus traded volume
Technical-analysis lessons often advocate a surge in volume at a breakout. On many retail spot-FX charts, however, the displayed indicator is tick volume—the number of price updates recorded by the platform's data feed during a bar—not the total currency amount traded throughout the global market. MetaQuotes' iTickVolume documentation identifies this series as bar-level tick volume.
A rise in tick volume can be useful as a within-feed activity clue, but it cannot prove that market-wide buyers or sellers participated at a particular rate. Comparing tick counts from different feeds as though they were a single consolidated volume measure would overstate what the evidence supports.
Spreads, slippage and economic events
A forex chart's quoted price may not equal the price available for entering and closing a position. A short is typically opened at the bid and closed at the ask; the bid-ask spread, any commission and financing charges can reduce gross returns. These costs may also change how a close to the neckline should be interpreted on the platform used for orders.
Slippage means a fill at a price different from the requested level. Fast markets, including periods around major data releases or central-bank decisions, can make execution less predictable; even a stop order need not fill at its trigger price. FOREX.com's US execution FAQ describes how prices may change before an order is filled. The CFTC's forex advisory also explains that margin leverage magnifies both gains and losses in OTC forex.
How reliable is the pattern, and when should traders avoid it?
There is no universal forex success rate that can be inferred from the shape alone. A percentage from one market, timeframe, chart feed or rule set cannot be applied to every head-and-shoulders trade; visually identified patterns can also differ among traders. OANDA's broader chart-pattern guide discusses this subjectivity when assessing pattern statistics.
Perfect shoulder symmetry is unnecessary, but a poorly defined head or very uneven reaction points may leave the neckline open to multiple interpretations. Examine the pattern in the context of the chosen timeframe and the larger trend: an inverse formation on a short-term chart inside a long-term uptrend might signal the end of a pullback, not a reversal of that larger uptrend.
A useful test would define the price series, prior-trend requirement, breakout close, entry model, stop rules and costs before comparing historical outcomes. Without that evidence, labeling the setup “high probability” or attaching a fixed win rate would be unsupported. If the neckline is hard to identify, the stop is disproportionate to the target, or the chart offers no coherent prior trend, passing on the setup is a defensible outcome.
Sources and evidence limitations
This guide draws on published pattern definitions and forex-market documentation, including StockCharts, TradingView, the Bank for International Settlements, MetaQuotes and the US Commodity Futures Trading Commission. No live executions, historical performance backtest or independent success-rate study was conducted for this article.
Educational information only, not personalized investment advice. Forex trading on margin carries substantial risk, including the possibility of losses beyond the amount initially deposited where applicable. Source review: October 28, 2026.

File a note
Leave Your Comment